City Council - Lines
Noyabrsk is a small, but strategically important city in Siberia with population over 100,000. The status of one of the key oil and gas centers has given Noyabrsk special growth prospects. The most up-to-date technologies are implemented here not only in the production and industry sectors, but in the municipal area as well
The City Council has decided to use the latest developments in the IT and IoT areas in order to make the urban space as convenient for the town residents as possible
The City Council has decided to use the latest developments in the IT and IoT areas in order to make the urban space as convenient for the town residents as possible
THE CITY COUNCIL SET OUT TO IMPROVE THE RESIDENTS' QUALITY OF LIFE. ONE OF THE FIRST DECISIONS MADE WAS TO REDUCE THE WAITING TIME IN LINES AT THE PUBLIC SERVICE CENTERS (VISITORS USED TO SPEND OVER AN HOUR WAITING IN LINE)

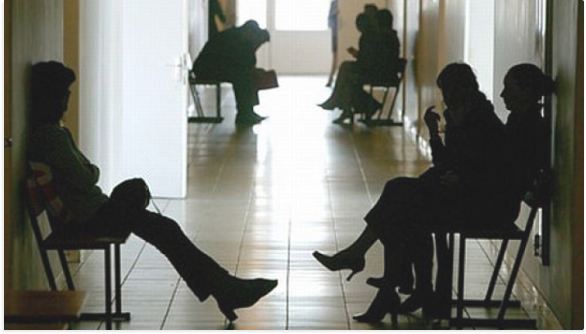
The current municipal infrastructure was not set up to solve such issues. A solution was needed that would allow the city government to manage the municipal public service centers quickly and efficiently, to ensure quick response to the residents' requests and to minimize the waiting time
Request
The Town Council contacted Center2M with the following request:

Develop a system that helps to manage the city's municipal public service centers quickly and efficiently
Using the system, solve the problem of reducing lines and overload
Implement the system within a short time
Fit into a limited budget
Solution
The Center2M team solved the problem using a video analytics system that allows:

The camera sends an image to the video analytics system whose artificial intelligence determines the number of people in a few seconds and returns the data to the Customers Service Center
Counting the number of visitors in real time

Using predictive analytics, the system makes a forecast of the size of the line at certain times of the office business hours
Determining and forecasting peak load times for the service center

Center management can quickly change the work schedule of free employees to distribute them with maximum efficiency during business hours
Distributing employees appropriately based on the schedule of peak times
SPECIALLY TRAINED NEURAL NETWORK COUNTED THE NUMBER OF PEOPLE IN THE FRAME AND DETERMINED HOW MANY PEOPLE WERE IN THE PUBLIC SERVICE CENTER AT ANY GIVEN POINT OF TIME
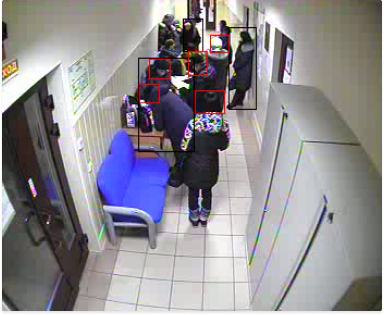
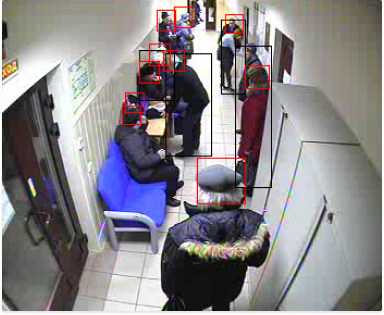
The neural network determines the number of people in the frame
Given all that, the management can receive information and monitor the situation remotely: all information is reflected on a graph which shows on which days the employees encounter the most requests and how much time they spend solving the problem for each visitor.
Once it decides that the number of people in line is becoming critical, the system alerts the center management within a few seconds. Having received the alert, the management can send to the front line those employees who are less busy or even ask for reinforcement from the next office.
A model detecting silhouettes was used to count the number of people.
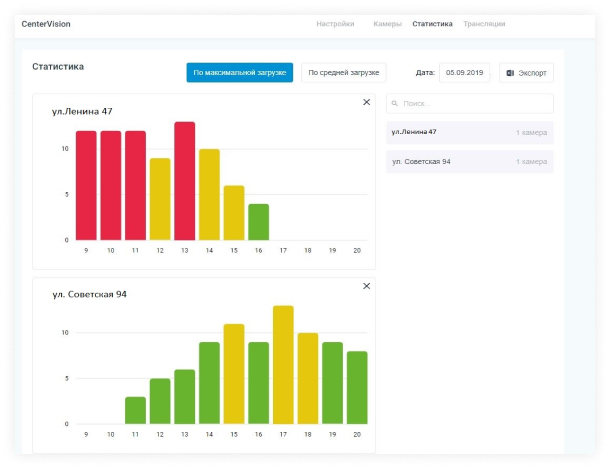
The graph of load of a municipal public service centers
How does it work?
In placing cameras, there may be so-called "overlap areas". These are areas that appear on several cameras. CenterVision allows specifying such areas in the system interface. People in such areas are counted accurately.
Then the value of the number of people in line is generated for several frames in a row for period ∆t. For each room values for a set of such periods is downloaded for half an hour. The length of the time period and the number of periods is defined based on the number of rooms and the processing capacity used.
Then the value of the number of people in line is generated for several frames in a row for period ∆t. For each room values for a set of such periods is downloaded for half an hour. The length of the time period and the number of periods is defined based on the number of rooms and the processing capacity used.
SUBSEQUENTLY THE COUNCIL IS PLANNING TO FORECAST THE MAXIMUM LOAD TIMES FOR THE CENTER USING PREDICTIVE ANALYTICS. THIS WILL HELP TO PLAN IN ADVANCE UPCOMING EVENTS AND RESOURCES, AS WELL AS TO OPTIMIZE THE USE OF RESOURCES

The total amount of the number of people in line is generated for each room
For each period, an array of values of the number of people in the room is generated. The most often occurring value is selected. If there are several values occurring with the same frequency, the largest is selected.
The value obtained is the number of people in line at time t, which directly follows the period observed. In just an hour, there is a set of values for various periods, i.e. values at times t_1, t_2 …. t_n.
The value obtained is the number of people in line at time t, which directly follows the period observed. In just an hour, there is a set of values for various periods, i.e. values at times t_1, t_2 …. t_n.
The value that occurs most often in the array is the number of people in line at time t
Then, the maximum and average values of the number of people are calculated for t_1, t_2 …. t_n and these values are reflected in a report as the peak and the average loads for a specific time.
The maximum and average values of the number of people are calculated and these values are reflected in a report
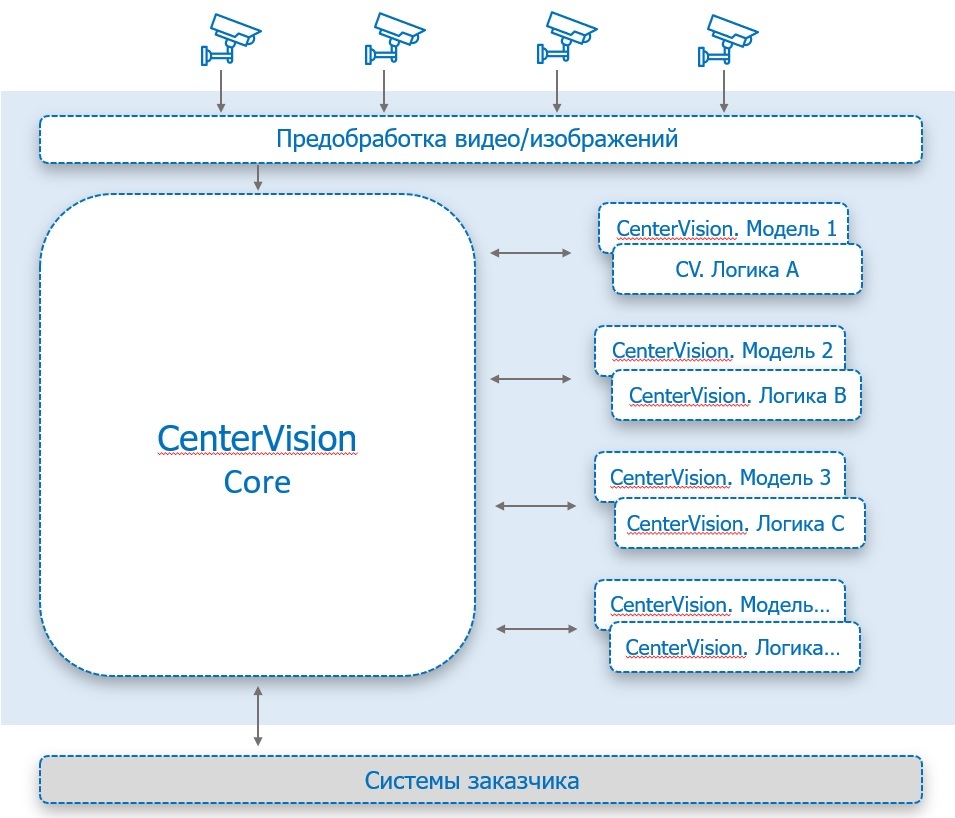
What are the components of the software system structure?
CenterVision Platform is a component of the platform for the central server, including servicing modules and a set of components for connecting to internal databases
Database: Oracle / PostgreSQL /MonqoDB, etc.
System operator interface includes various system settings and a user interface, which are accessible depending on a user's role

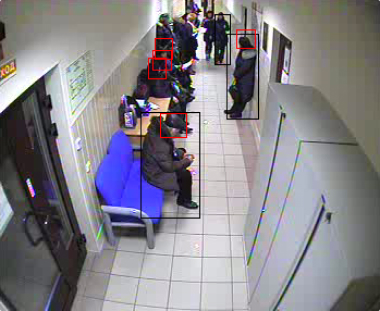
THESE RESULTS WERE ACHIEVED WITH MINIMAL EXPENSES. IT WAS NOT NECESSARY TO REPLACE OLD CAMERAS AND INSTALL NEWER ONES: CENTERVISION WORKS VERY WELL WITH LOW RESOLUTION CAMERAS OF 640X480. OWING TO THE SYSTEM, REGULAR CAMERAS PROVIDING A CLOUDY AND UNINFORMATIVE IMAGE WERE TURNED INTO SMART SYSTEMS ALLOWING COORDINATING AND MONITORING WORK AT THE OFFICE

Result
BEFORE CenterVision implementation
UP TO 1.5 HOURS
IN A LINE OF 20-30 PEOPLE
IN A LINE OF 20-30 PEOPLE
NO MORE THAN 25 MINUTES
IN A LINE OF 3-5 PEOPLE
IN A LINE OF 3-5 PEOPLE
AFTER CenterVision implementation
People practically do not have to wait in line
The number of peak load values was reduced
80%

A trained neural network model for recognizing the number of people based on Center2M technology is the algorithm obtained using a collection of updated program libraries for machine learning geared towards finding and classification of images